Business Intelligence (BI) tools are the fastest-growing data visualization tool, and the Business Intelligence market is highly dynamic and created wider opportunities in the market. Moreover, those with knowledge of the Tableau software tool will get wider opportunities than the other tools in the market.
What is Tableau? Data visualisation tableau is a very user-friendly software tool used for data visualization. The purpose of utilising this tool is due to the efficiency, speed, derivation of valuable insights from the chart and graph, ability to calculate massive data, and handling of the datasets.
If you are interested in learning the Tableau business intelligence tool, you can join Tableau Training in Chennai and learn the uses of Tableau, the application of Tableau, the Tableau product suite and what is Tableau software.
In this blog, we shall discuss what is Tableau? Benefit of data visualization Tableau, uses of Tableau and application of Tableau.
Why is Tableau software?
Tableau also provided Tableau Public, the software’s cost-free version. A developer cannot save every data visualization on the Tableau server; instead, Tableau Public server is also used to protect all data. This is the main distinction between Tableau Professional and Tableau Public. Another critical difference between Tableau Public and Tableau Professional is the Free version’s restriction on the number of data sources a tableau developer may connect to.
The best thing about Tableau Public is how well it visualises the data that Tableau Professional can access. Professionals can also investigate free learning options from Tableau, such as Tableau Starter Kits, which split Tableau training videos, social events, and product practice exercises so that users can interact with ever more complex product features.
Professionals can also sign up for the Tableau Community, which offers a wide range of ways to connect with other professionals. One can benefit from networking and education opportunities by joining a local Tableau User Group, perusing our forums, and utilizing Tableau Public.
What is Tableau?
Tableau is one of the most influential and rapidly expanding data visualization tools in the business intelligence sector. It aids in the simplification of raw data in an obvious manner.
With the help of Tableau, data can be generated by professionals at any level of a business. Because of it, non-technical persons can also create distinctive dashboards. Quick data analysis is possible with the Tableau programme, and worksheets and dashboards that are created are visualisations.
The best features and Benefit of data visualization tableau
- Data Blending
- Real-time analysis
- Collaboration of data
The amazing thing about Tableau software is that anyone can use it without technical or programming knowledge. People from all sectors, including companies, researchers, various industries, etc., have shown interest in the instrument.
If you want to become a cloud computing specialist, you can AWS Training in Chennai, which will help you understand the introduction to Cloud Computing
Service Models, Cloud Deployment Models, how Tableau integrates with AWS services and why data visualization tableau is used.
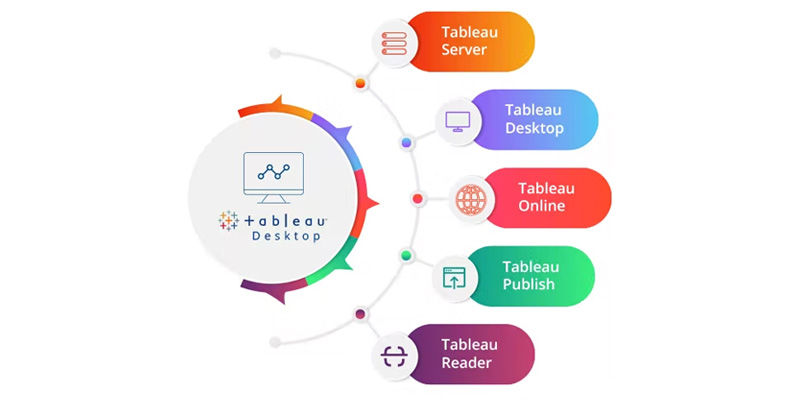
The Tableau product suite
The Tableau Product Suite consists of
- Tableau Desktop
- Tableau Public
- Tableau Online
- Tableau Server
- Tableau Reader
Data analytics in the Tableau application can be divided into two categories for easy understanding.
Developer Tools: Tableau development tools, such as those used to create dashboards, charts, reports, and visualizations, fall under this heading. Tableau Desktop and Tableau Public fall under this category of Tableau products.
Sharing Tools: As the name suggests, the goal of these Tableau products is to disseminate the dashboards, reports, and visualizations produced with developer tools. Tableau Online, Server, and Reader are products in this category.
Let’s examine each Tableau product individually.
Tableau Desktop: You may code and edit reports using Tableau Desktop, which has a robust feature set. Everything is done in Tableau Desktop, from making the charts and reports to combining them to creating a dashboard.
Tableau Desktop offers accessibility to Data Warehouse and other files for real-time data processing. The produced workbooks and dashboards are used to be shared privately or publicly.
Tableau Desktop is divided into various categories based on its connectivity to data sources and publishing options.
Tableau Desktop Personal: The development tools are identical to those in Tableau Desktop. The workbook is kept secret; only certain people can view the personal version. There is no way to publish the workbooks online. It should therefore be shared either offline or through Tableau Public.
Tableau Desktop Professional: It is very identical to Tableau Desktop. The distinction is that the content produced by Tableau Desktop can be shared online or in Tableau Server. Additionally, all datatypes are fully accessible in the Professional version. The people who want to publish their work in Tableau Server should use it the most.
Tableau Public
This version of Tableau is created with budget-conscious users in mind. By “Public”, it means that the completed workbooks cannot be kept locally and must instead be saved to Tableau’s public cloud, which can be viewed and accessed by anyone.
Since anyone can view and download the files stored in the cloud, no security is associated. This is the best version for those who want to study Tableau and individuals who wish to share information with the world.
Join Cloud Computing Courses in Bangalore, which has scrupulously designed the course for Bangalore- based students who intend to begin their career in cloud computing.
Tableau Server
The programme is designed primarily to distribute workbooks and visualizations produced by the Tableau Desktop application around the company. Before sharing dashboards on the Tableau Server, you must publish your work in Tableau Desktop. Only authorized people can access the work once it has been uploaded to the server.
However, licensed users are exempt from the requirement to install Tableau Server on their computers. They only need their log-in information to verify data via a web browser. Tableau servers have high levels of security and are ideal for efficient and speedy data exchange across a business.
The organization’s admin will always have complete control over the server. The organization maintains both the software and the hardware.
Tableau Online
As the name implies, it is an online sharing tool for Tableau. Although it has comparable features to Tableau Server, the data is saved on servers on the cloud that the Tableau group manages.
The amount of data published in Tableau Online has no storage restriction. Moreover, Tableau Online connects to more than 40 cloud-hosted data sources, including Structured Query Language, Hive, Amazon Aurora, Spark SQL, and many others.
If you are interested in learning SQL language, you can join SQL Training in Chennai, which will help you understand SQL Functions, core concepts of SQL, and components of SQL: the Data Manipulation Language (DML), the Data Definition Language (DDL), and the Data Control Language (DCL).
The workbooks created by Tableau Desktop are necessary for publishing on both Tableau Online and Server. Tableau Server and Tableau Online allow data streaming from web apps like Salesforce.com and Google Analytics.
Tableau Reader
The workbooks and visualizations produced using Tableau Desktop or Tableau Public can be accessed using the free software Tableau Reader. Filtering the data is possible, but modification and editing possibilities are limited. Anyone who obtains the workbook can access it using Tableau Reader. Hence there is no security level in Tableau Reader.
Tableau Reader must be installed on the recipient’s computer to view any dashboards you share. Now, we shall discuss the data visualization tableau, its uses of Tableau and how Tableau will work.
To have a profound understanding of AWS architecture, you can join AWS Training in Bangalore, which will help you understand the application of Tableau, Auto Scaling In AWS, Amazon Virtual Private Cloud (VPC), Elastic Load Balancing and many other core concepts of AWS.
Uses of Tableau and benefits data visualization tableau
Data that is kept in different places are connected and extracted using Tableau. It can obtain information from any platform that is possible. Tableau can extract data from diverse sources, including simple datasets like excel or pdf, to complicated databases like Oracle, databases in the cloud like Amazon Web Services, Google Cloud SQL, Microsoft Azure SQL database and many others.
Join the Oracle Training in Chennai and learn Restrict, Group, Sort, Filter Data, Data Types SQL Constraints and many other oracle concepts.
When Tableau launched in the market, preconfigured data connectors enabled you to connect to any database. Depending on the version you purchased, Tableau supports a different number of data connectors.
The collected data are transferred or linked live to Tableau Desktop, the company’s data engine. The data engineer and analyst use the retrieved information to create visualizations. Users have access to the produced dashboards as a static document. The users who obtain the dashboards utilize Tableau Reader to examine the file.
It is possible to publish data from Tableau Desktop to Tableau Server. The interaction, dissemination, management, security architecture, and automation features are supported by this enterprise platform. The end-user has a better user experience using the Tableau server to access files from any location, whether a PC, mobile device, or email.
What is tableau software and uses of Tableau
The primary functions and applications of Tableau are as follows:
- Business Intelligence
- Data visualization tool
- Data Collaboration
- Data Blending
- Simple execution and implementation
- Has the ability to manage the massive dataset
- Has the ability to create interactive visualizations
- Support various mobile devices
- Analyzing data in real-time
- Visualization of query translation
- To build data queries with no coding
- To control massive metadata
- No possibility of scheduling
- No imported custom visuals
If you are interested in the cloud computing field, you can join Cloud Computing Training in Bangalore and learn core concepts of cloud architecture, services, benefits, Cloud Computing Service Models, and Cloud Deployment Models.
Excel Vs. Tableau
Although both Excel and Tableau are data analysis tools, they have different methods for exploring data. However, Tableau’s analysis is more effective than Excel.
Tableau allows dragging and dropping to explore excel data, unlike Excel, which works with rows and columns in spreadsheets. Tableau presents the data in Graphs, which are clear images.
| Parametes | Excel | Tableau |
| Purpose | The spreadsheet application will help you handle the data | Tableau is the best visualisation tool used for analysing the data. |
| Usage | It is appropriately used for analyzing the data structure | It is a quick and fast data visualisation tool used for solving massive data issues. |
| Performance | Moderate speed without an accelerating option. | The average speed with alternatives to increase and optimise an operation’s development. |
| Security | The security features built-in are weak, and security software requires regular updation | It provides high-level security, and low-level data security is strictly avoided. |
| User Interface | Basic scripting knowledge is required. | Without any coding knowledge,the Tableau can be used. |
| Products | Microsoft Office tools included | Includes a variety of versions, including desktop, cloud, and Tableau server. |
| Integration | Excel connects to about 60 other programmes. | Tableaus has around 250 applications integrated. |
| Easy Visualizations | You should have a solid understanding of the Excel features in order to make the visualisations simple to interpret. | In contrast, the data is shown right away in Tableau. |
If you are interested in learning Microsoft Azure cloud computing, you can join Microsoft Azure Training in Chennai, which will help you understand Microsoft Windows Azure Fundamentals, develop Windows Azure and Web Services, develop Microsoft Azure Solutions and advanced SQL Azure.
To sum up, Tableau outperforms Excel in several key categories, including interactive dashboards, visualizations, the ability to work with massive amounts of data, and many more.
What are the benefits of data visualization tableau
- Tableau is a robust data visualization tool with one of the fastest-growing markets in the business intelligence sector.
- Tableau Desktop, Tableau Public, Tableau Online, Tableau Server, and Tableau Reader make up the Tableau Product Suite.
- You may code and edit reports using Tableau Desktop with the help of a robust feature set.
- Workbooks created in Tableau Public are saved locally; instead, they must be saved to the public cloud of Tableau, which is accessible to everyone.
- The Tableau Desktop application’s workbooks and graphics are shared throughout the company using Tableau Server.
- The data is maintained on servers housed in the cloud and managed by the Tableau group, yet Tableau online has all the same functionalities as Tableau Server.
- Data kept in different places is connected to and extracted using Tableau. It can obtain information from any platform conceivable.
- The workbooks and visualizations produced using Tableau Desktop or Tableau Public can be viewed using the free utility Tableau Reader.
- Tableau is an excellent visualization tool for analysis, while spreadsheet software is utilized to manipulate data.
Now that you have understood what is Tableau? Uses of Tableau and why data visualisation Tableau is the best BI tool. So, to learn more about Tableau, you can join Tableau Training in Bangalore and learn the application of tableau and its uses of Tableau.

